
Virginia's K-12 School Accountability System

WHY WE DID THIS STUDY
In 2024, the Joint Legislative Audit and Review Commission (JLARC) directed staff to review Virginia’s recently revised accountability standards for public K–12 education.
ABOUT K-12 ACCOUNTABILITY
The Every Student Succeeds Act requires states to have an accountability system that evaluates K–12 public school performance and identifies schools that need support. The current Virginia Board of Education redesigned the state’s school accountability system, measuring student and school performance across a variety of academic and non-academic indicators.
WHAT WE FOUND
Virginia’s new accountability system is more effective and useful than the state’s prior system
The Virginia Board of Education (VBOE) approved new K–12 public school accountability regulations in October 2024. The new system—called the School Performance & Support Framework (SPSF)—replaced the prior school accountability system that had been in place since 2017 (figure). VBOE’s two primary goals when designing the new accountability system were raising standards for public K–12 schools and increasing transparency into school performance. The board set these goals in response to perceived shortcomings in how the state’s prior accountability system measured and reported school performance.
The SPSF is an improvement over the prior system. Rather than having separate federal and state systems, the SPSF combines Virginia’s state and federal accountability systems, which reduces complexity and aligns policy goals. The SPSF also has design elements that more precisely and comprehensively measure performance than the prior system. For example, the SPSF better differentiates performance across schools, uses indicators that measure a single element of school performance (as opposed to combining multiple elements into a single indicator), and has elements that incentivize schools to focus on a greater proportion of students, especially those in specific subgroups.
The SPSF structure is generally sound, but refinements are needed
The SPSF is sufficiently effective and useful at measuring school performance, so its general structure should be used for school accountability in Virginia going for-ward. The SPSF’s basic structural elements (e.g., indicators, weighting, measurement, and scoring) are generally consistent with federal and expert guidance and accounta-bility systems in other states. Using the SPSF structure will also help maintain con-tinuity and consistency, which is important for producing comparable results over time and reducing the administrative burden for school divisions.
Though the SPSF structure should be maintained, it can be improved by refining certain elements. These include refinements to the performance labels, category scoring thresholds, and technical rules related to certain individual indicators.
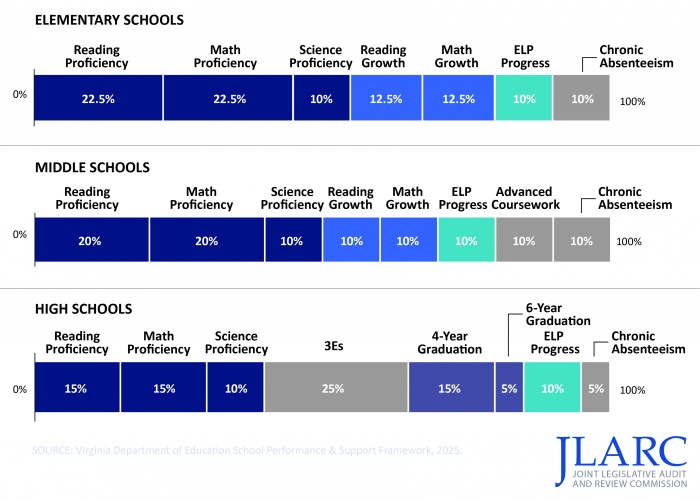
The SPSF uses a combination of indicators to measure school performance (2024–25 school year)
VBOE is also considering several changes to the framework as part of an amendment to the state ESSA plan. Several of these changes would implement JLARC recommendations or a policy option in this report.
School results are more distributed and generally lower in the SPSF than the prior system
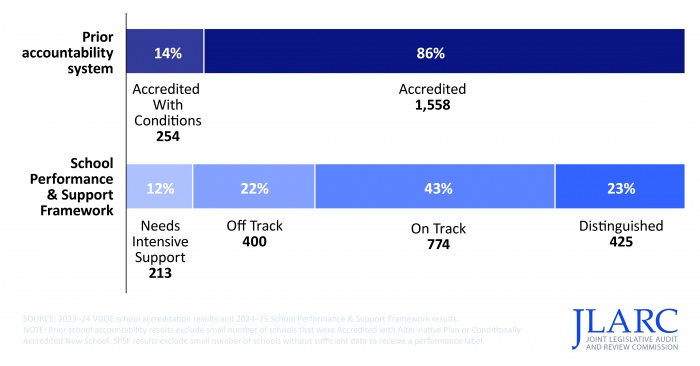
The SPSF produced summative scores for all K–12 public schools in Virginia for the 2024–25 school year. Based on those scores, 425 schools (23 percent) were labeled Distinguished, 774 (43 percent) On Track, 400 (22 percent) Off Track, and 213 (12 percent) Needs Intensive Support.
The SPSF produced results that were more distributed across school performance categories than the prior system (figure). Rather than most schools receiving the highest label, a meaningful proportion of schools received each label.
SPSF assigns lower performance labels to more schools compared with prior system (2023–24 to 2024–25)
SPSF labels do not clearly communicate performance, nor do they clearly relate to each other as part of a continuous scale
The SPSF aggregates school performance across multiple indicators to produce a numerical summative score and corresponding performance label: Distinguished, On Track, Off Track, or Needs Intensive Support. The board chose to use descriptive labels because of “strong” feedback in favor of this format over others, such as an A–F grading system, during stakeholder listening sessions.
Subject-matter experts and research literature note that developing descriptive labels that are clear, widely understood, and broadly accepted can be challenging. Stakeholders bring different perspectives and many have strong opinions about accountability ratings, making it difficult to design ratings that satisfy everyone. According to VDOE and VBOE leadership, the terms are designed to use plain language easy for stakeholders to understand. However, the terms On Track and Off Track imply a school performance trajectory (improving or declining, respectively), which is not the intent of the performance labels and does not accurately characterize at least some schools with those labels. Division and school staff were particularly concerned about the use of the term Off Track, believing it to be overly negative. Additionally, the Distinguished label overstates the performance of at least some schools in the category that underperform on some individual indicators.
In addition, the four SPSF performance labels are not related to each other or part of a continuous scale, which could lead to further confusion. There is no intuitive progression through the SPSF labels, in part because the middle two labels focus on whether schools are “on” or “off” track, while the top and bottom labels use unrelated terms. This discontinuity may exist because the labels were drawn from multiple states’ accountability systems rather than modeled after a single, internally consistent scale.
SPSF scoring thresholds ignore differences in how schools are measured, benefiting high schools
The SPSF evaluates elementary, middle, and high schools using different sets of indicators with varying weights. For example, graduation rate and career and college readiness indicators are used for high schools, whereas growth indicators are used for elementary and middle schools. Proficiency indicators have a different weight for each school level. Experts recommend that when indicators and weights are materially different, states should consider using different scoring thresholds for each school when assigning ratings.
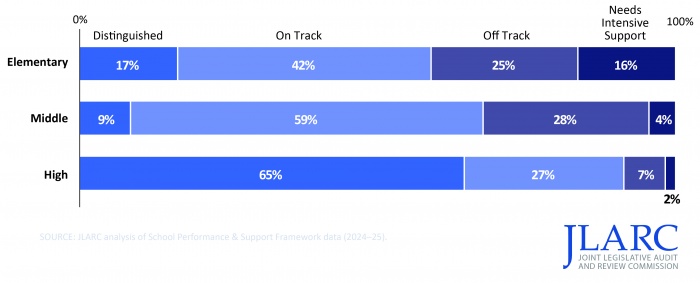
Despite differences in how performance is evaluated for schools at different levels, the SPSF uses the same scoring thresholds for elementary, middle, and high schools. This reduces the comparability and fairness of results across school levels. For example, it is far easier for high schools to achieve higher overall ratings than elementary or middle schools because it is easier for them to achieve higher scores on certain indicators used only for the high school level (figure).
High schools are much more likely to have higher ratings than elementary and middle schools
The SPSF’s proficiency weighting is higher than most states but is ultimately a policy decision
Proficiency and growth indicators are heavily weighted in the SPSF and are an improvement over the prior accountability system. The SPSF’s proficiency and growth indicators are more transparent and useful because each indicator measures a single element of school performance (as opposed to being combined under the prior system). The SPSF’s use of “indexing” to score proficiency and growth is also an improvement because it encourages schools to focus on improving all students’ performance; not just those with scores close to the threshold needed to “pass” an assessment.
The SPSF weights proficiency much more heavily than growth when compared with other states. Proficiency indicators collectively have 2.2 times the weight of growth indicators for elementary schools and 2.5 times the weight of growth indicators for middle schools. Other states are fairly evenly split among prioritizing proficiency, prioritizing growth, or weighting them equally. Only two states prioritize proficiency over growth more than Virginia.
Ultimately, though, the weighting between proficiency and growth is a policy decision. VDOE cited that parents, higher education representatives, employers, and military leaders emphasized the importance of graduates who are proficient. However, participants in VBOE “listening sessions”—which included parents, school and division staff, school board members, and other stakeholders—generally agreed that growth should be weighted at least the same as proficiency. Nearly all subject-matter experts interviewed by JLARC indicated that the SPSF could weight growth at least somewhat more than it does currently. Subject-matter experts and research literature indicate that student growth captures schools’ contribution to student performance better than proficiency, which is typically closely related to student demographics.
Uncapped 3Es scoring allows individual students and some schools to score too many points, which distorts overall scoring
The SPSF includes an indicator to measure high school students’ college, career, and military, referred to as the “3Es” indicator. The 3Es (employment, enrollment, and enlistment) indicator measures student achievements in three pathways that are intended to demonstrate student readiness for post-graduation. College, career, and miliary readiness indicators are commonly used in school accountability systems nationwide, and the criteria used in other states are generally similar to those in the SPSF’s 3Es.
The board’s design of the 3Es indicator is intended to (i) incentivize schools to make college, career, and military opportunities available to students, and (ii) encourage broad participation and exploration across each pathway. Therefore, to reward schools for students who pursue multiple opportunities and discourage schools from directing a student on a single pathway, the SPSF allows a student’s points to be totaled across different pathways. As a result, the 3Es is unique among SPSF indicators because an individual student can score points across multiple pathways (up to 3.5 points). This means that a school can have a maximum unweighted indicator score of 350 for the 3Es but only 100 or 125 for all other SPSF indicators.
The 3Es scoring—which is not constrained or capped—means that a high school’s summative score may be driven more by the 3Es indicator than was intended by the weight assigned to the indicator and that the scores of some students can be used to compensate for others. The 3Es indicator is weighted at 25 percent of the SPSF, but actually comprises about 34 percent of the summative score, on average, for schools with a high 3Es indicator score. In addition, some high schools score so many points on the 3Es indicator that it produces a summative score that gives a misleading and distorted view of their actual overall performance across all indicators. Finally, because an individual student can score up to 3.5 points, a single high-achieving student can compensate for (i.e., “mask”) lack of achievement by one or several lower-performing students.
Including more English learners is positive, but criteria for when to include those who have recently arrived could be adjusted
The SPSF includes more English learners when measuring schools’ proficiency, growth, and English Language Proficiency (ELP) progress indicators than the previous accountability system, which Virginia needed to do to align the SPSF with federal requirements. The previous system excluded all English learners from counting toward these indicators until their sixth year of enrollment. This was an outlier nationwide, and subject-matter experts interviewed indicated this was a problem and were not aware of another state with similar practices.
The rules guiding when to include English learners’ academic content assessments (e.g., SOLs) in schools’ proficiency and growth performance calculations are among some of stakeholders’ top concerns with the new framework. Virginia could consider an adjustment that would partially address schools’ concerns while still maintaining compliance with federal requirements and alignment with experts’ opinions.
ELP progress indicator reweighting for schools with few English learners should be adjusted
Despite an overall acceptable design, the English Language Proficiency (ELP) scoring and weighting in certain circumstances needs to be refined. For example, many schools do not have enough English learners for the ELP progress indicator to count toward their summative score, so the indicator’s weight is redistributed to other indicators to calculate schools’ scores. This meaningfully alters how a substantial portion of elementary and middle schools are evaluated, reducing the comparability and fairness of results. For schools at which the ELP progress indicator is excluded, this redistribution meaningfully increases the weight given to growth from 25 to 35 percent for elementary schools and from 20 to 30 percent for middle schools, while the weight of all other indicators remains the same.
VDOE is redesigning state’s school improvement program, but it is too early to determine its effectiveness
Improving student performance in low-performing schools is difficult, and research on the success of these efforts is mixed. A 2020 JLARC evaluation found several serious problems with VDOE’s approach to providing school improvement services.
VDOE has been redesigning and implementing a new school improvement program in conjunction with the development of the SPSF. The redesigned program has positive features and appears to be an improvement over prior approaches. VDOE is decentralizing school improvement, moving away from Office of School Improvement staff as the primary providers of support services and toward tailored services using staff from various VDOE offices. Under the new approach, specialists in the agency will provide support services based on schools’ specific performance gaps. VDOE is hiring additional subject-matter specialist staff to help provide this new support, alongside the agency’s existing staff.
Though the new approach appears promising, it is too early to determine whether it will ultimately be successful. While VDOE has included some high-level information on the new program in reports and presentations, the agency has not yet produced a formal consolidated plan for how it will provide support. The lack of such a plan for a large scale, complex undertaking may make it difficult for VDOE staff, school division staff, and school staff to clearly understand their roles and responsibilities. Ultimately, the effectiveness of the new program cannot be determined until services have been provided for long enough to be evaluated.
Currently, there is no statutory requirement for VDOE to deliver an effective school improvement program, nor for VBOE to ensure that a program is being effectively implemented. Because this function is critical, and these efforts require sustained attention, subsequent superintendents and the board will need to prioritize supporting an effective school support model over the long term.
WHAT WE RECOMMEND
Legislative action
- direct the superintendent of public instruction to consistently and effectively implement the state’s program to support low-performing schools.
- direct VBOE to ensure the state administers an effective state program to support low-performing schools.
- direct VDOE to submit a detailed plan for the state’s improvement program and annual status reports.
Board of Education action
- develop new performance labels that more clearly convey performance and are part of a continuous scale.
- develop new scoring thresholds that are unique to each school level and result in relatively comparable proportions of elementary, middle, and high schools receiving each label.
- change the scoring of the 3Es indicator by capping the total number of points a student or school can receive.
- redistribute the weight for the English language proficiency progress indicator proportionally across all other indicators for schools without sufficient English learners.
- contract for an independent evaluation of the effectiveness of the state’s school improvement program and use the results to improve the program as needed.
The full list of recommendations is available here.