
Spending and Efficiency in Higher Education

WHY WE DID THIS STUDY
In 2023, the Joint Legislative Audit and Review Commission (JLARC) directed staff to review public four-year higher education institutions. This report addresses changes in students’ cost of attendance, institutional revenue and spending, and opportunities to reduce the cost of higher education.
ABOUT VIRGINIA'S PUBLIC FOUR-YEAR HIGHER EDUCATION INSTITUTIONS
Institutions rely on tuition and fee revenue and state general fund appropriations to operate. Collectively, in FY23, institutions received about $3 billion in tuition and fee revenue and more than $2 billion in state general funds. In the 2023–24 academic year, the 15 institutions enrolled about 211,000 full-time equivalent students.
WHAT WE FOUND
Student costs have stabilized with increased state funding for higher education
Over the last decade, the growth of student costs to attend a Virginia public four-year higher education institution has slowed. When adjusted for inflation, the published total cost of attendance increased 5 percent overall since 2014 (less than half a percent annually), partially because of high inflation rates in recent years.
Increased state general fund appropriations have helped minimize the growth in student costs. State appropriations increased by about $590 million (FY14 to FY23) and were over $2 billion in FY23. Recently, this increase in appropriations has contributed to the total cost of attendance declining, on average, across institutions.
Despite cost stabilization, many students still have debt upon graduation
Many students still need to borrow to afford higher education, despite recent stabilization in student costs. About 54 percent of all students at a Virginia public institution borrow at least some funds to pay for their higher education. The average debt of these students who borrow and graduate with a bachelor’s degree from Virginia higher education institutions is about $30,000, which has grown about 15 percent in the last decade. Students who do not complete their degree can also have substantial amounts of debt not captured in state or national measures of indebtedness.
Institutional spending growth has moderated recently; instruction made up the largest portion of spending growth
Virginia institutions’ spending, on average, has grown consistently over the past 20 years but has moderated in recent years. Total spending by Virginia’s 15 public four-year institutions increased 64 percent (adjusted for inflation) over the past 20 years. This was greater than the national average for public four-year institutions during that time period, which was 50 percent. However, spending in FY23 was just 2 percent higher than FY19 levels. This moderation in inflation-adjusted spending is largely because of a one-time decrease in overall spending, related to the pandemic, and high inflation rates in 2022 and 2023.
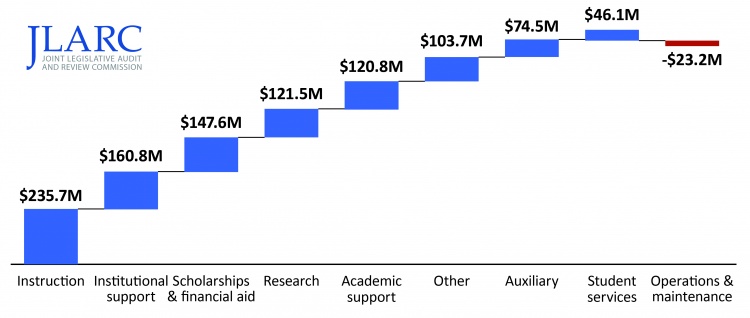
Collectively, public institutions’ total operating spending growth over the last decade was driven by more spending on instruction. Institutional support, scholarships/financial aid, research, and academic support also drove spending growth over the last decade. Together, these five spending categories accounted for about 80 percent of institutions’ spending growth—about $800 million of $1 billion—from FY14 to FY23 (figure).
Instruction has been the largest driver of spending growth (FY14–FY23)
Business and finance staffing levels have grown the most
Staffing is the largest expense for Virginia institutions. Personnel spending—including staff salaries, wages, and benefits—makes up 60 percent of total institutional spending. Statewide, total staffing at higher education institutions increased 12 percent (~4,900 FTE employees) from FY14 to FY23; or about 9 percent per student. The greatest growth was 2,885 staff in business and finance, followed by 1,553 staff in academic occupations (i.e., instruction or research). Proportionally, the growth in business and finance staff was greatest, as the number of employees in this category more than doubled from FY14 to FY23.
Majority of Virginia institutions spend about the same or less than similar institutions nationwide
After controlling for factors that can affect spending levels, 10 of Virginia’s institutions spend about the same as or less than hundreds of similar institutions nationwide (figure). These results suggest Virginia institutions’ spending levels are generally not excessive or unreasonable. However, opportunities remain to reduce spending through greater efficiencies.
Majority of Virginia institutions spend less than or about the same per FTE student as similar institutions nationwide

Spending per student at individual institutions has changed for a variety of reasons, including declining enrollment
Spending levels that remain constant or increase as enrollment declines result in reduced spending efficiency. Declining enrollment, rather than increased spending, has been the primary driver of less efficient spending per student at most Virginia institutions. Institutions have fixed costs, such as facilities, that do not decrease when student enrollment drops. The 10 institutions where enrollment declined between FY14 and FY23 all currently spend more per student than they did 10 years ago.
Spending drivers vary somewhat by institution, but there are some common themes (table). For example, student aid and scholarships were a spending driver at all but three institutions. Non-instructional functions were a spending driver at seven institutions.
Non-instructional functions, auxiliary enterprises, and scholarships and student aid most often drove spending increases (FY14–FY23)

Institution-funded research (not externally funded research) was a spending driver at VCU. VCU has been building its research capacity, which has increased the amount of its institution-funded research. This research spending is intended to better position the institution to attract externally sponsored research funding in the future.
This push has resulted in VCU’s institution-funded research spending growing about four times faster than its externally funded research over the past decade (greater than Virginia’s three other largest research institutions during the same period). The increase in VCU’s institution-funded research resulted in the most growth by far in cost per student (+$4,800) of all Virginia research institutions, after adjusting for inflation.
Virginia institutions have implemented efforts to address efficiency and student costs, to varying degrees
Implementing efficiency strategies is particularly important for institutions where cost efficiency has been reduced (e.g., increased spending per student), partially because of enrollment declines.
Virginia institutions with declining enrollment have made progress implementing strategies to better align institutional operations with stagnant or declining enrollment levels. Examples include:
- Mary Washington, Virginia State, Longwood, and UVA-Wise have reduced overall staffing levels over the past decade.
- Longwood has reduced the number of academic programs it offers. Mary Washington, Radford, UVA-Wise, and Virginia Military Institute offer about the same number as a decade ago.
- Longwood, Mary Washington, Radford, UVA-Wise, VCU, and Virginia State reported closing or demolishing various campus buildings, terminating leases for unused or additional space, and/or repurposing existing campus space to better suit current needs. VCU also reported selling various properties.
In addition to efforts to reduce operations, institutions report implementing efficiency strategies that have produced meaningful savings.
Higher education landscape will necessitate continued attention to efficiency and student costs at most institutions
Institutions have made efforts to improve cost efficiency and reduce student costs, but additional efforts are needed to better align spending levels with student enrollment levels. The changing higher education landscape will require all but the most selective institutions to maximize efficiency, manage spending, and maintain affordability. The enrollment shift toward larger and flagship institutions may continue, and demographic projections show institutions will be competing for fewer students in the near future. Moreover, surveys show that families and students are less convinced that a four-year degree is necessary, and affordability continues to be a challenge for many.
This new landscape will require institution boards and the state’s six-year higher education planning process (sidebar) to remain focused on maximizing efficiency and containing student costs, especially at institutions where cost efficiency is being reduced because of declining enrollment.
Many institutions charge substantial student fees to pay for athletics
Institutions vary widely in the amount of institutional support provided to intercollegiate athletics, but most require students to pay substantial fees for athletics. Schools with larger student enrollment can reduce fees charged per student because they are able to spread the cost of athletics over more students.
Seven institutions charge an intercollegiate athletics fee to students that is at least $2,000 per academic year
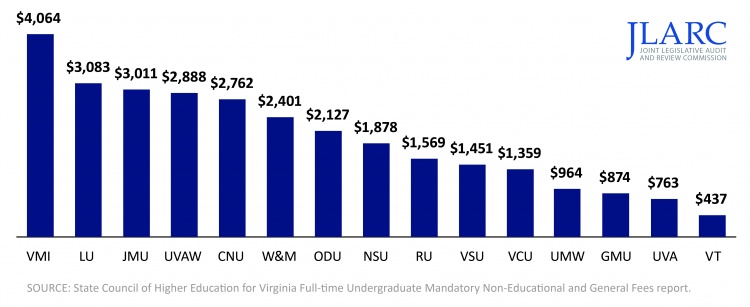
Statute limits the proportion of overall athletics revenue that can be funded through institution subsidies. These limits have helped control the impact of intercollegiate athletics on student costs. However, because the limits are based on a percentage of overall revenue, student fees and institutional funds for collegiate athletics can still grow as athletics revenue grows. Staff at institutions and other experts expect athletics spending and revenue to continue to increase. An additional cap on student fees and institutional funds for athletics, which is based on a designated proportion of the total cost of attendance, could help further control athletics costs paid by students and institutions
WHAT WE RECOMMEND
Legislative action
- Include in the duties of boards of visitors at public four-year higher education institutions the responsibility to fully consider the impact that policies and decisions in non-instructional areas have on student costs.
- Require as part of the six-year planning process that institutions experiencing reductions in cost efficiency because of declining enrollment report their efforts to improve efficiency and/or better align operations with enrollment levels.
- Constrain the amount of students’ fees and institutional funds that can be allocated to intercollegiate athletics by establishing a maximum proportion of the total cost of attendance that student fees and institutional funds cannot exceed.
Executive action
- Through the six-year planning process, monitor institutions’ efficiency efforts to align operations with enrollment levels and recommend plans to identify further efforts when necessary.
The complete list of recommendations is available here.