
Virginia's K-12 Funding Formula

WHY WE DID THIS STUDY
The General Assembly (SJ 294) directed the Joint Legislative Audit and Review Commission (JLARC) to study the cost of education in Virginia and make an accurate assessment of the costs of the Standards of Quality.
ABOUT THE STANDARDS OF QUALITY FORMULA
The Standards of Quality (SOQ) funding formula is how the General Assembly fulfills its constitutional obligation to seek to establish and maintain a high quality public school system. The formula estimates how many staff positions are needed for each school division, then applies cost assumptions to estimate the cost of K–12 staff needed in each division. That cost is then apportioned between the state and each local government using the Local Composite Index.
WHAT WE FOUND
Virginia divisions receive less funding than multiple benchmarks
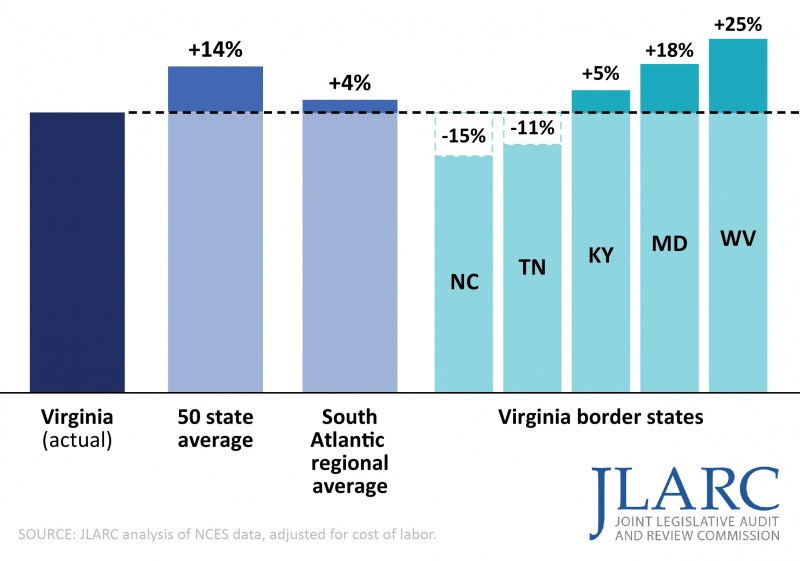
Virginia school divisions receive less K–12 funding per student than the 50-state average, the regional average, and three of Virginia’s five bordering states (figure). School divisions in other states receive 14 percent more per student than school divisions in Virginia, on average, after normalizing for differences in cost of labor among states. This equates to about $1,900 more per student than Virginia.
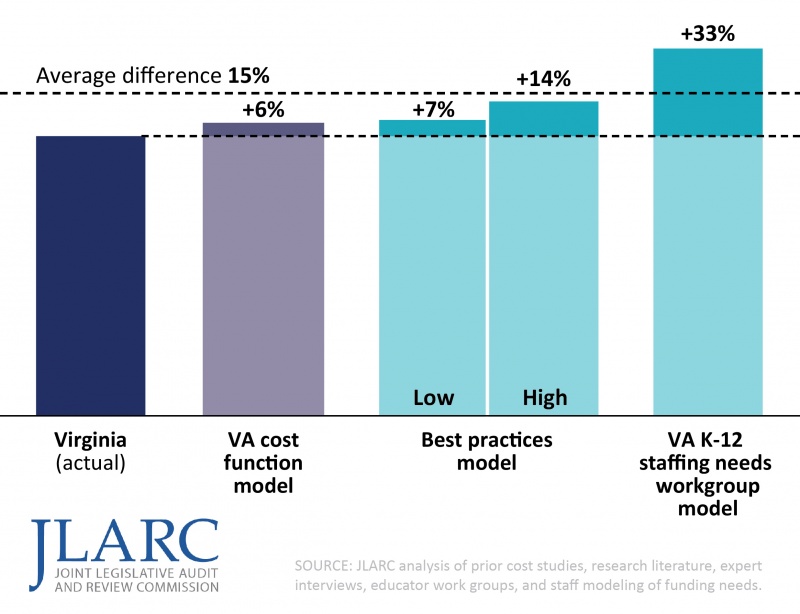
Virginia divisions receive less funding than what three Virginia-specific funding benchmark models suggest is needed to provide students a quality education (figure). Depending on the benchmark, Virginia school divisions were estimated to need 6 percent to over 30 percent more funding. Between 73 percent and 89 percent of the state’s school divisions receive funding that is below benchmarks, depending on the model and assumptions used.
Virginia school divisions receive less funding than national and regional averages (FY20)
Virginia school divisions receive less funding than amounts benchmark models estimate is needed (FY21)
State SOQ formula yields substantially less funding than actual division spending and benchmarks
The SOQ formula is intended to calculate the funds needed to provide a high quality education, but SOQ total funding is well below actual school division expenditures. The SOQ formula calculated school divisions needed a total of $10.7 billion in state and local funding for FY21, but divisions actually spent $17.3 billion on K–12 operations, $6.6 billion more than the funding formula indicated was needed. Funding differences for the preceding years were about the same. The vast majority of the additional funding for school divisions comes from local governments.
While the SOQ funding formula’s calculations were substantially less than actual expenditures, they were even further below the funding levels the benchmark models determined were needed. The models estimated Virginia should provide 66 percent to 93 percent more funding than the SOQ formula’s calculations.
Total statewide staffing needs calculated by SOQ formula are less than actual employment levels and workgroup estimates
One of the reasons the SOQ formula’s funding calculations are well below both actual practice and benchmarks is that the formula substantially underestimates K–12 staffing. In FY21, the SOQ formula calculated that divisions needed 113,500 FTE staff to perform the various instructional, student support, and administrative functions of the K–12 system. However, divisions actually employed 171,400 staff (51 percent more) to perform these responsibilities. The difference was even larger between the formula’s calculations and estimates developed by the Virginia K–12 staffing workgroups (sidebar). The workgroups estimated that divisions need more than 100,000 staff statewide above the SOQ formula’s calculations.
The SOQ formula underestimates staffing needs in each of Virginia’s school divisions. Between FY19 and FY21, every school division in the state employed more staff than the SOQ formula calculated they needed. In FY21, the SOQ formula calculations ranged from as low as 43 percent of the number of staff actually employed in one division to 99 percent of the number of staff actually employed in another.
In interviews, many school division administrators characterized the state’s staffing standards as unrealistic, often citing the difference between SOQ staffing calculations and the number of staff they actually needed to employ. Administrators said: “It’s a misnomer to call it the SOQ; it’s not quality at all;” and “If we just funded at SOQ level, it would be a catastrophe.”
SOQ formula systematically underestimates division compensation costs
The SOQ formula not only underestimates the number of K–12 staff needed, but also school divisions’ compensation costs. Several factors contribute to the formula’s low compensation cost assumptions. The formula underweights salaries paid by the state’s largest school divisions, even though these divisions employ a majority of K–12 staff and account for a majority of staffing costs. This results in the formula underestimating the salaries and related compensation costs of the majority of SOQ-recognized positions.
The difference between SOQ-calculated compensation costs and actual compensation costs for SOQ-recognized staff (excluding health care) has been about $1.3 billion annually. The difference is most substantial in larger divisions. For example, the average very large division (more than 30,000 students) spent about $139 million on compensation for SOQ-funded staff above the SOQ formula’s calculations.
The formula also does not fully and routinely update the salary cost assumptions used, resulting in less funding for salaries than is needed. Compensation supplements, which the state uses to increase compensation funding over time, have not been consistently provided, and funding amounts have not been based on a clear measure or objective, such as keeping pace with projected inflation or achieving an average salary goal.
Formula still uses Great Recession-era cost reduction measures
The historic decline in state revenue during the Great Recession led to a series of changes to the SOQ formula that reduced funding. Many of these changes remain in place as of late June 2023—more than a decade since the Great Recession ended.
A few of these changes, such as a change in health-care insurance calculations, have improved the formula and have a clear rationale. However, several of the changes lack clear and justifiable rationales or do not reflect current practices. The three largest Great Recession-era changes together reduced state funding by $487 million in FY22 (table).
Recession-era formula changes still result in large state funding reductions
|
Change |
Reduction in state funding, FY22 (in millions) |
|
Cap on support positions |
$331 |
|
Changes to non-personal costs |
148 |
|
Change to federal deduction |
12 |
|
Total |
$487 |
SOURCE: JLARC analysis of Annual School Report data and VDOE documents.
Formula does not adequately account for higher needs students; methodology for at-risk students undercounts students in poverty
An effective SOQ formula should account for the higher costs divisions incur because of factors outside their control. Divisions have little or no control over how many higher needs students (at-risk due to poverty, special education, or English learners) live in their division. On average, divisions need more funds to educate these students.
The SOQ formula does not adequately account for higher needs students. State funding for at-risk students, special education students, and English learner students is less than the level of funding determined necessary to educate them in cost studies performed in other states.
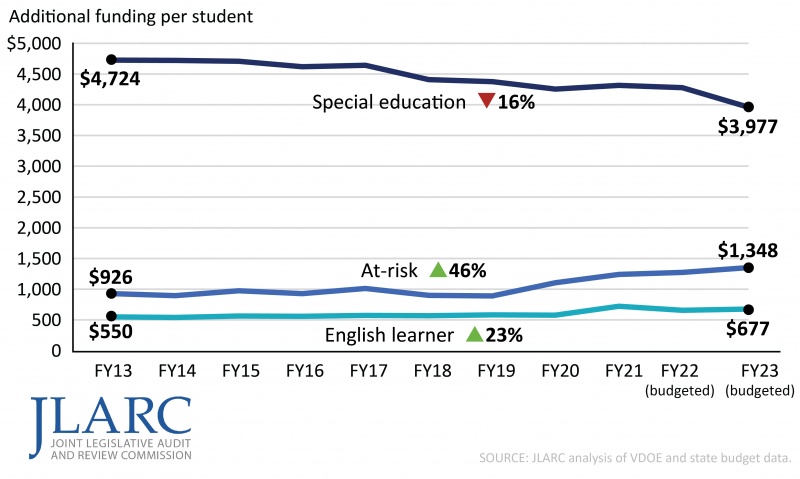
Over the last 10 years, state funding has increased per student for at-risk students (+46 percent) and English learner students (+23 percent) but declined for special education students (figure). The total amount of state funding for special education has remained fairly constant over this period, while the special education student population has grown. While state funding per student has declined, the total actually spent per student on special education has increased 17 percent from FY13 to FY21, after adjusting for inflation. This additional funding for special education has mostly come from local governments.
State funding for special education has declined; funding for at-risk students and English learners has increased
The SOQ formula relies on an outdated measure to determine the number of at-risk students. Free lunch eligibility was historically based on the number of students who applied and were approved for free lunch and was used to measure student poverty in several at-risk funding formulas. However, with the establishment of a new federal program in 2014, a large portion of schools and divisions are no longer required to collect free lunch applications. The state’s policy, as directed in the Appropriation Act, is to continue using the last application-based free lunch rates reported by those schools and divisions. However, for some schools and divisions, that data is now several years old and actual student poverty has increased. The state’s school nutrition program has developed a more reliable methodology for determining the number of free lunch eligible (at-risk) students. This program estimated that 53 percent of students in the state are free lunch eligible in contrast to the outdated free lunch methodology, which recently estimated the at-risk population to be only 39 percent statewide.
Formula does not adequately account for local labor costs
An effective education funding formula should also account for higher labor costs. Virginia’s SOQ formula attempts to account for higher labor costs in some divisions through the cost of competing adjustment, which provides varying funding increases to divisions in and around Northern Virginia.
The cost of competing adjustment provides less additional funding than actual salary differences. For example, Arlington County Public Schools receives a 9.83 percent adjustment for teachers’ salaries but its actual labor costs are 40 percent more than the average Virginia school division’s labor cost.
In addition, the adjustment excludes school divisions in other higher cost labor markets. Several school divisions in the Central Virginia and Tidewater regions have above average labor costs and do not receive a cost of competing adjustment.
Formula does not adequately account for small divisions’ inability to gain economies of scale
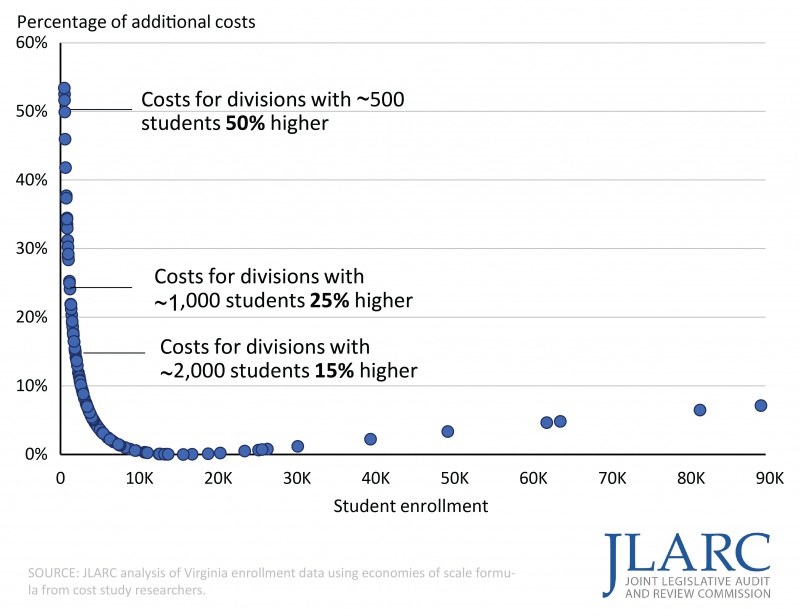
An effective education funding formula should account for the higher cost per student divisions incur when they are too small to achieve operational efficiencies (economies of scale). As enrollment increases, the marginal cost of K–12 operations typically decreases. Research finds that divisions achieve most of their efficiency gains when they have at least 2,000 students. Virginia’s SOQ formula provides no additional funds to small divisions to account for their higher per student costs.
Research literature shows that small school divisions with less than 2,000 students tend to spend more per student than larger divisions, after accounting for differences in cost of labor (figure). Even though small divisions spend more per student, (i) a smaller portion of their total spending is on instruction, and (ii) a greater portion is on fixed, non-instructional expenses such as transportation, administration, and facilities. Small, rural counties have especially high transportation costs because of their large geographic size and small student populations. Small school divisions also need to employ more staff per student because of the need to offer a broad range of classes but with fewer students per class.
Cost per student is substantially higher for divisions with fewer students
Despite being 50 years old, LCI formula remains a reasonable measure of local ability to pay
The state uses the local composite index (LCI) to determine each local government’s ability to contribute to K–12 funding. The LCI determines the local and state split of SOQ formula funding estimates for each locality. (The state pays a higher share of the SOQ formula estimate for school divisions in less wealthy localities and a lower share for divisions in wealthier localities.)
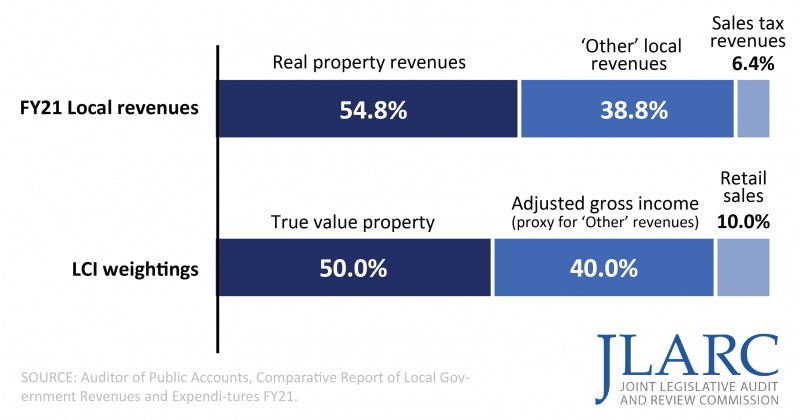
The LCI formula’s original assumptions about which revenue sources Virginia localities rely on are still reasonably close to today’s revenue sources. The LCI was developed by the 1972–1973 Task Force for Financing the SOQs to acknowledge that state and local funding obligations need to account for differences in local ability to pay. Five decades later, local revenue sources and the proportion of revenue from the various sources are not substantially different from the early 1970s (figure).
Though the LCI is a reasonable measure of ability to pay, it can lead to sudden, large changes in the state or local funding share between biennia for certain divisions. Moreover, since the LCI’s creation, better data has become available, and there has been growing consensus nationally and among experts that a measure known as “revenue capacity” can even more accurately and fairly measure local ability to pay.
Proportion of local revenue sources remains similar to original LCI weightings
State can consider a wide range of changes to improve the SOQ formula
This report includes near-term and long-term recommendations and policy options to strengthen the SOQ formula. Near-term recommendations could be implemented sooner, while long-term recommendations represent more complex changes that would take more time to design and implement. Policy options are proposed when elements of the formula do not have to be changed based on the evaluation criteria, but improvements could still be made.
The estimated cost of implementing major recommendations and options is summarized in the table below. The financial impact of the changes shown here reflect what the impact on the state budget would have been in FY23, after accounting for all funding appropriated that year. In addition to the state budget impact, there are also substantial changes in local funding obligations depending on the recommendation or policy option. However, because many local governments already contribute more than is required under the SOQ formula, the actual financial impacts on most local government budgets would likely be proportionally lower than the impact on the state budget. Financial impacts will also vary for each individual school division. Additional details on the local share of funding and division-level impacts are available here.
These recommendations and policy options would improve the state’s education funding formula and better ensure a quality education for Virginia students. Much of the additional funding allocated under this report’s recommendations and options would go toward employee compensation, hiring additional staff as needed to address critical student needs (e.g., reduce longstanding achievement gaps), or providing support services to higher needs students. The return over time on this additional spending would likely be evident through a higher quality teacher workforce and students who are better prepared to succeed. These outcomes are expressly set forth as goals in the Code of Virginia for the state’s public K–12 system.
Summary of near-term and long-term recommendations
|
|
State $ impact (FY23) |
Percent change |
|
Recommendations: Near term |
|
|
|
Address technical issues with the formula |
$45M |
0.6% |
|
Discontinue Great Recession-era cost reduction measures |
$515M |
6.5% |
|
Calculate prevailing costs using division average, rather than LWA |
$190M |
2.4% |
|
Change Local Composite Index to three-year average |
−$1.5M |
−0.02% |
|
Convert non-SOQ At-Risk Add-On funding to SOQ-required funding |
-- |
-- |
|
Replace outdated and inaccurate free lunch measure |
$250M |
3.2% |
|
Consolidate two largest at-risk programs into new SOQ At-Risk Program |
||
|
Direct further study of special education staffing needs |
-- |
-- |
|
Recommendations: Long term |
|
|
|
Develop & adopt new staffing ratios, based on actual staffing |
$1,860M |
23.5% |
|
Update out-of-date salary assumptions during re-benchmarking |
Depends on timing a |
|
|
Replace cost of competing adjustment with newer, more accurate method |
$595M |
7.5% |
|
Adopt economies of scale adjustment to assist small school divisions |
$90M |
1.1% |
SOURCE: JLARC staff analysis and estimates using in-house JLARC SOQ model developed to approximate fiscal impact.
NOTE: The financial impact of the changes shown here reflect what the impact on the state budget would have been in FY23, after accounting for all funding appropriated that year. Division-level and local funding impacts can be found on the JLARC website.
a Cost impact is heavily dependent upon rate of inflation during year in which implemented. Examples given in Chapter 8 of report.
Summary of policy options to change the formula
|
|
State $ impact (FY23) |
Percent change |
|
Policy options |
|
|
|
Implement funding plan to achieve state goal for teacher salaries |
Depends on goal and plan |
|
|
Weight student and general population equally in local composite index |
−$45M |
−0.5% |
|
Replace local composite index with revenue capacity index |
−$85M |
−1.1% |
SOURCE: JLARC staff analysis and estimates using in-house JLARC SOQ model developed to approximate fiscal impact.
NOTE: Division-level and local funding impacts can be found on the JLARC website.
Most other states use simpler student-based K-12 funding formulas, in contrast to Virginia’s complex staffing-based formula
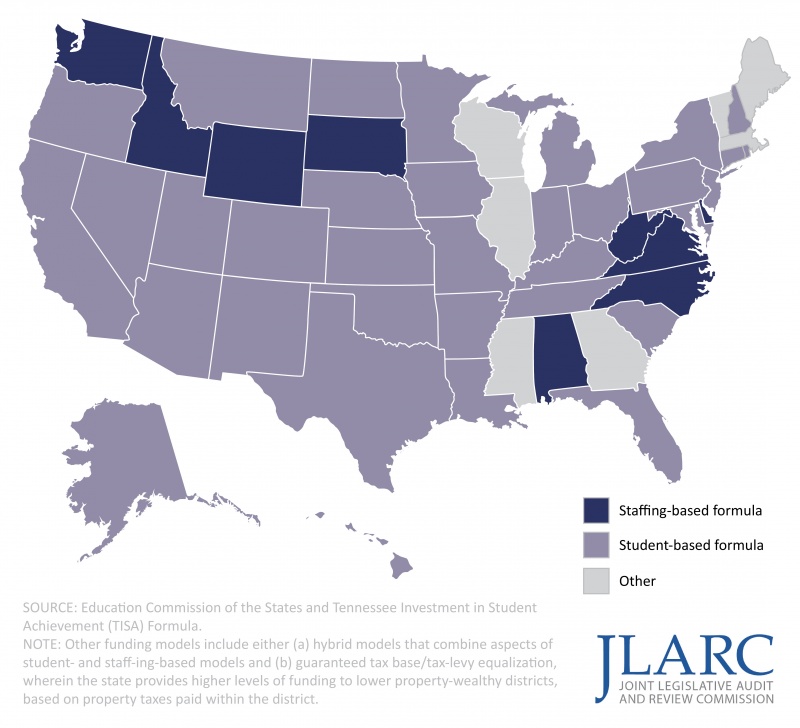
Virginia is one of only nine states that use a staffing-based formula, and some academic experts now view it as an outdated approach. The vast majority of states (34) use a student-based funding formula that allocates divisions a specified amount of funding per student (figure). Seven states use hybrids of the staffing- and student-based approaches or another approach.
A well-designed student-based funding model would be more accurate, more transparent, and easier to maintain over time than Virginia’s current staffing-based formula.
Implementing a student-based funding formula is estimated to cost an additional $520 million to $1.2 billion above FY23 funding, depending on how the new formula is implemented.
Majority of states use a student-based funding model instead of a staffing-based funding model
SOQ funding formula maintenance and support has been problematic
The SOQ formula’s staffing and funding calculations do not reflect prevailing practice. This is largely because the formula has been altered piecemeal by prior governors and General Assemblies based on available revenue in a given year. In addition, changes that are necessary to adapt the SOQ formula and keep it in line with prevailing practice are often not made.
The state needs to build a more robust and modern approach to maintaining and updating its SOQ funding formula that is removed from the budgetary processes. The IT application used by VDOE to maintain the SOQ formula is cumbersome and old, and its internal calculations are opaque. School divisions lack the full information and understanding necessary to accurately report financial data that is used in SOQ funding calculations. Divisions also need more information and support from VDOE on financial reporting and budgeting.
WHAT WE RECOMMEND
Legislative action
- Long term – Develop accurate fixed and prevailing staffing ratios that are simpler, easier to apply, and comprehensive.
- Near term – Eliminate the support cap and re-instate (a) non-personal categories removed in FY09 and FY10, and (b) federal fund deduction methodology used prior to FY09.
- Long term – Routinely update the cost assumptions used for school division salaries during the re-benchmarking process.
- Near term – Calculate salaries and other cost assumptions using the division average, rather than the linear weighted average.
- Long term - Replace the cost of competing adjustment with a Virginia-based labor cost index.
- Long term - Adopt a new economies of scale adjustment applicable to divisions with fewer than 2,000 students.
- Near term – Calculate the LCI using a three-year average.
- Near term – Provide funding as needed to modernize K–12 reporting and the IT application used for the SOQ formula.
- Near term – Provide funding as needed for additional VDOE staff to maintain SOQ formula and provide support to divisions.
Executive action
- Fix technical problems with the SOQ formula related to excluding central office staff positions, facilities staff, and inflation and enrollment projections.
- Modernize K–12 reporting and IT application used for SOQ formula.
-
- Determine staffing needed to adequately maintain funding formula and provide support to divisions.
The complete list of recommendations is available here.