
Addressing the Cost of Public Higher Education in Virginia

Why we did this study
The General Assembly directed JLARC to study the cost efficiency of the state’s institutions of higher education and to identify opportunities to reduce costs. Interest in this topic was spurred by substantial increases in tuition and fees in recent years and the high debt load of Virginia students. This report, which is the final in JLARC’s higher education series, presents options and recommendations to address the rising cost of public higher education in Virginia (HJR 108, 2012).
About Higher Education in Virginia
Virginia’s longstanding support for public higher education can be traced to the early 19th century. Virginia’s higher education system has multiple stakeholders, but is highly decentralized and provides institutions’ boards of visitors with substantial autonomy. While state higher education operating funding per student has declined over the past two decades, state funding still represents six percent of general fund expenditures.
What we found
Virginia’s higher education institutions are high quality but high cost
Virginia’s 15 public four-year higher education institutions collectively achieve their missions—to educate and graduate students—better than most. Virginia ranked second among all states in terms of average six-year graduation rates. The graduation rates of UVA, the College of William and Mary, and Virginia Tech ranked among the nation’s top 20 public colleges and universities.
The state’s public institutions are also, on average, among the nation’s most expensive for students. In FY 2012, Virginia had the fifth highest net cost in the country. The average net cost of attendance for all in-state students attending Virginia’s public four-year institutions far exceeds the southeast regional and national averages.
Spending increased, primarily on non-academic services
Total institutional operating spending per student increased 24 percent, accounting for inflation, between FY 2002 and FY 2012. The majority of this spending growth was on the non-academic services known as auxiliary enterprises, which include intercollegiate athletic programs, student housing, student dining, and security. Auxiliary enterprises accounted for 56 percent of the total increase in inflation-adjusted, per student spending. The remaining spending increase was distributed relatively evenly across instruction, support services, and other functions such as research.
Auxiliaries were primary driver of higher spending per student (FY 2002–FY 2012)
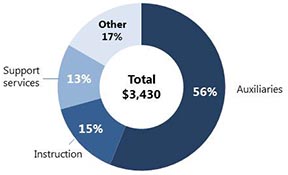
SOURCE: JLARC staff analysis of data from U.S. Department of Education’s Integrated Postsecondary Education Data System (IPEDS). NOTE: Data is in constant 2013 dollars. Statewide spending is calculated per FTE student using Delta Cost Project methodology.
Tuition revenue increased to compensate for declining state funding
As institutions spent more, they raised tuition and fees to collect additional revenue as state funding declined. On average, the decline in state funding accounted for the majority of the increase in tuition revenue. The increase in net tuition revenue varied substantially across institutions, but on average, the additional tuition revenue has exceeded the declines in state operating funding over the long term. Since FY 1998, net tuition revenue increased $4,177 per student, exceeding the $2,831 decline in state funding per student. This varied widely, however, with four institutions actually receiving less combined revenue from students and the state in FY 2012 than they did in FY 1998.
State operating funding per in-state student is one-third less than it was in the late 1990s. Virginia’s funding for public higher education has consistently been below that of other states. In FY 2012, Virginia provided $4,800 in state operating support per student, about 25 percent less than the national and southern state averages.
As a result, all institutions now rely more heavily on students to fund their core missions. In FY 1998, net tuition revenue was 42 percent of the combined revenue used to fund E&G operations coming from students and the state. By FY 2012, the net tuition portion had increased to 64 percent.
Statewide, increase in net tuition primarily occurred due to decline in state funding; net revenue increased, but not at all institutions (FY 1998–FY 2012)
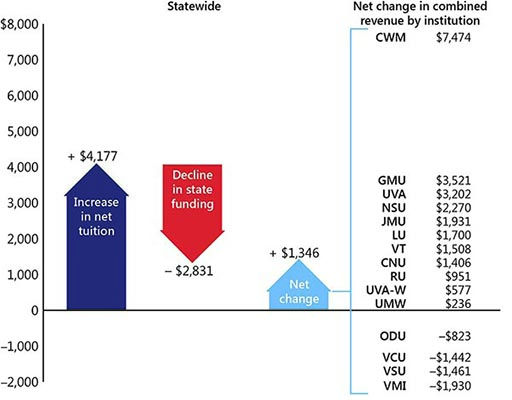
SOURCE: JLARC staff analysis of state appropriations data provided by SCHEV, Delta Cost Project data on FY 1998 net tuition revenue, IPEDS data on FY 2012 net tuition revenue, and the Consumer Price Index. NOTES: Data is in constant 2013 dollars. Net tuition revenue data is calculated per FTE student (for both in-state and out-of-state students) using Delta Cost Project methodology. State appropriations data is calculated per FTE in-state student. Statewide averages are weighted for enrollment.
Boards of visitors appear to have limited ability to influence decisions
In Virginia’s decentralized higher education system, the General Assembly has vested primary responsibility for each public higher education institution with a board of visitors. Despite being vested with this responsibility, board members responding to a JLARC staff survey reported having a limited ability to influence certain institutional decisions. For example, about half of current board members responded they have a limited ability to influence decisions about institutional efficiency or non-academic spending. Nearly one-third of current board members reported that they understand higher education operations or public finance only "somewhat," "slightly," or "not at all."
State approach to providing operating funds does not sufficiently reflect varying situations at institutions
Some institutions have more difficulty than others adapting to state funding declines. Chief among these are Virginia State, UVA-Wise, Norfolk State, and ODU, because of certain characteristics, including:
- a higher reliance on state funding and tuition for total revenue (as compared to institutions that have considerable revenue from federal research or private funding sources);
- a higher percentage of in-state students, who pay much lower tuition than out-of-state students; and
- a higher percentage of students from families with lower ability to pay tuition.
In terms of state funding policy for higher education, most institutions are not fully funded according to the state’s established funding model, known as base adequacy. The state has also not met its goal for shared funding responsibility between students and the state. Additionally, state policy does not reflect the differing abilities of institutions to raise tuition revenue.
| Operating funding: Major JLARC options | Improve affordability & access | Increase state costs | Prioritize academics | Limit institutional autonomy |
|---|---|---|---|---|
| Option 2: Revise funding policy to account for characteristics that limit ability to generate additional revenue | ||||
| Option 3: Allocate higher proportion of funding to the institutions least able to fund operations and those with students least able to afford tuition | ||||
| Option 5: Limit tuition increases; provide additional general funds |
Schools spent more on non-academic functions, particularly intercollegiate athletics, while having difficulty funding academics
As noted above, the primary driver of institutional spending growth has been auxiliary enterprises. These non-academic functions are funded through mandatory non-E&G fees paid by students. Five institutions in particular increased these non-E&G fees while also having basic operating funding shortfalls: UVA-Wise, Christopher Newport, Norfolk State, Longwood, and ODU.
Across all institutions in Virginia, mandatory non-E&G fees have increased substantially and now represent one-third ($3,502) of total tuition and fees. There have been two primary drivers of this fee growth. The first is intercollegiate athletics. The second is a variety of facilities and services provided in response to on-campus enrollment growth and student demand for amenities.
On average, athletic programs generated only 31 percent of revenue needed to cover program expenses in FY 2012. Students funded the remaining 69 percent of expenditures. The funding provided by students to subsidize this shortfall equated to, on average, 12 percent of total tuition and mandatory fees (or 31 percent of mandatory non-E&G fees). Mandatory athletic fees are not directly related to core academic mission, and in many cases the athletic programs benefit a relatively small number of students.
The expansion of auxiliary services other than athletics also contributed to student costs. Institutional debt service, which represents a fixed cost, comprises about 17 percent of mandatory non-E&G fees. This still leaves approximately half of all non-E&G fees ($1,745 per student) going toward other non-academic services. One former member of a board of visitors responding to JLARC’s survey noted,
While many students appreciate the services provided by the mandatory fees of the university, a much more disciplined approach to providing those services should be instituted. Do we really need the intercollegiate athletic programs as they exist? Are all of the gyms and fitness centers that have been built necessary? It is time to provide an education at affordable costs, which might mean returning to focusing on the costs of education and reducing non-essential services.
The state’s current five percent cap on the growth of mandatory non-E&G fees allows numerous exceptions, which six institutions have used to more than double these fees since the cap was established. Actual growth averaged 99 percent between FY 2003 and FY 2014 due to repeated use of exemptions, but would have been only 71 percent if institutions had strictly adhered to five percent annual growth. Cumulative growth varied substantially across institutions, ranging from 215 percent growth at Christopher Newport to 59 percent growth at JMU.
| Non-academic spending: Major JLARC recommendations | Improve affordability & access | Increase state costs | Prioritize academics | Limit institutional autonomy |
|---|---|---|---|---|
| Recommendation 3: Limit mandatory athletics as a proportion of total tuition and mandatory fees | ||||
| Recommendation 4: For institutions that exceed the limit on athletic fees, submit plans to reduce fees | ||||
| Recommendation 5: Propose reductions in spending on auxiliary services (excluding athletics and debt service) funded with mandatory non-E&G fees | ||||
| Recommendation 6 and 7: Remove exemptions to fee growth cap, and require approval to exceed the cap |
State and individual institutions have relied heavily on debt to expand or improve campuses, and maintenance needs have grown
Spending to construct and renovate non-academic facilities is often funded using debt incurred by individual institutions, which fund their debt service payments through mandatory student fees and user fees. Individual institutions have borrowed to fund construction and renovation, nearly quadrupling their annual debt service. Total annual debt service for the 15 four-year public institutions grew from $106.2 million in FY 2002 to $421.4 million in FY 2013. Debt service on this institutional debt is equivalent to nine percent of total E&G spending by the four-year public institutions in Virginia.
Spending to construct and renovate academic facilities is funded with debt incurred by the state. Annual state debt service payments (totaling $3 billion since FY 2002) have increased more than 600 percent. Annual state debt service payments for capital debt grew from $70 million in FY 2002 to $439 million in FY 2013. Debt service payments now account for nearly one-third of all state operating and capital support.
At colleges and universities around the country, borrowing and capital spending have generally increased over the past two decades, but Virginia’s borrowing and spending have been exceptionally high. On a per student basis, total state and institutional capital spending and debt service payments substantially exceed national and regional averages. Last year, Virginia spent $2,782 per student on capital projects, which was more than twice the national average of $1,353.
Institutions expanded and improved their campuses, despite declines in (1) state general funds and (2) student ability to afford higher education. On average, square footage per student increased 14 percent between 2004 and 2011. This has required increased borrowing by the state and individual institutions, which has created long-term, fixed costs that—particularly for institutions with stagnating or declining enrollment and lower ability to generate additional fee revenue—may be a substantial budgetary constraint moving forward.
Amid this substantial capital spending, existing facilities have deteriorated. As of FY 2011, the total deferred maintenance on E&G facilities was estimated at $1.4 billion, or approximately 19 percent of the replacement value of Virginia’s higher education E&G facilities. This maintenance backlog has long-term cost implications. National research has found that every $1 of deferred maintenance results in $4 to $5 of long-term capital liabilities.
| Capital and maintenance: Major JLARC options & recommendations | Improve affordability & access | Increase state costs | Prioritize academics | Limit institutional autonomy |
|---|---|---|---|---|
| Recommendation 9: Prioritize capital requests using objective and cross-institutional analysis | ||||
| Recommendation 10: Use prioritization criteria to determine which projects are recommended for funding | ||||
| Option 6: Increase state maintenance funds; increase state oversight |
State student aid falls short of goal, and allocation could better prioritize needs of low- and middle-income students
Federal and state governments, institutions, and private individuals provide student aid in order to reduce the cost of higher education to students and families. Research has found that student aid increases levels of college enrollment and completion, particularly when awarded to low-income students and in a transparent manner.
Student aid in Virginia, though, meets only one-third of financial need, and financial need has grown faster than available funding over the past decade. Virginia provides student aid based on financial need through the Virginia Student Financial Assistance Program (VSFAP). The state does not meet its funding goal for VSFAP, and the portion of its funding goal met has decreased from 65 percent in FY 2010 to 43 percent in FY 2014.
VSFAP funding has not been allocated among institutions in a manner that accounts for the varying ability of students to afford higher education. While VSFAP allocations meet 77 percent of financial need recognized at UVA, they meet only 40 percent or less at six institutions that have a greater percentage of low- and middle-income students: VCU, Norfolk State, ODU, Virginia State, George Mason, and Mary Washington.
Current state policy gives institutions substantial autonomy to award VSFAP funds. Institutions have used this autonomy to award VSFAP funds to high-income students, even though average unmet need is greater among low- and middle-income students. Across institutions, eight percent of funds were awarded to high-income students. Three institutions—Christopher Newport, VMI, and William and Mary—awarded 15 percent or more to high-income students.
One-third of the state’s total student aid is currently allocated through the Tuition Assistance Grant program. Tuition Assistance Grant funds are provided to in-state students who attend private institutions. Aid through this program is allocated irrespective of financial need.
| Student aid: Major JLARC options & recommendations | Improve affordability & access | Increase state costs | Prioritize academics | Limit institutional autonomy |
|---|---|---|---|---|
| Recommendation 15: Reallocate state student aid across schools | ||||
| Recommendation 16: Restrict state student aid funds to low- and middle-income students | ||||
| Option 7: Redirect state aid funds from private to public institutions |